In Thursday's class we were assigned to make an Infograph using PIKTOCHART DOT COM. We were given four different subjects to chose from to research about.
- Peanut Butter and Jelly Sandwiches
- California Community College Enrollment
- Diabetes
- Filing Federal Tax Returns
I wanted so badly to pick Peanut Butter and Jelly Sandwiches but I thought it would be more professional of me to chose Diabetes.
Infograph's are a great visual aid to make a point on a particular subject. It tells a story with pictures, statistics, and colors. The concept sounds simple enough and almost elementary, but it has been scientifically proven that people respond to bright colors and attractive things. What better way to get someone's attention than with an inforaph? Its packed with great informative stats and percentages that can a person intrigued.
Wikipedia's definition: Information graphics or infographics are graphic visual representations of information, data or knowledge intended to present complex information quickly and clearly. They can improve cognition by utilizing graphics to enhance the human visual system’s ability to see patterns and trends.
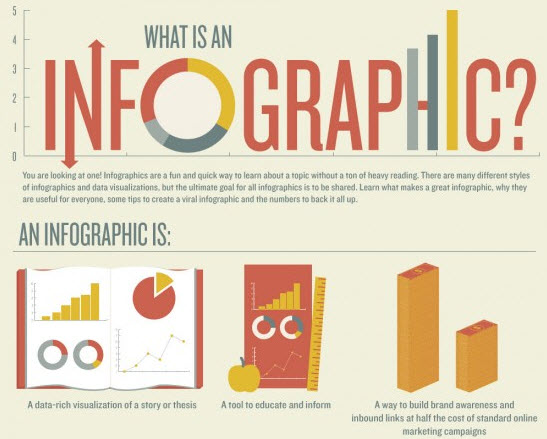
All of this information on infographs I'm sure is quite helpful, but the best way to show a great infograph and what exactly it is, is to show you.
This is a great infograph about infographs! This was made by Beth's Blog site. You can visit her and more of her great Infographs on her blog site. Beth's Blog
This is a great infograph about infographs! This was made by Beth's Blog site. You can visit her and more of her great Infographs on her blog site. Beth's Blog
This is another great infograph, again, about infographs. This was made by Adrienne So. on Wired dot com. You can visit the original site here. Wired dot com on INFOGRAPHS

No comments:
Post a Comment